Articles
- Page Path
- HOME > Res Community Public Health Nurs > Volume 35(1); 2024 > Article
-
Original Article
- Bidirectional Relationship Between Depression and Frailty in Older Adults aged 70-84 years using Random Intercepts Cross-Lagged Panel Analysis
-
Ji Hye Shin1
 , Gyeong A Kang1, Sun Young Kim1, Won Chang Won2, Ju Young Yoon3
 -
Research in Community and Public Health Nursing 2024;35(1):1-9.
DOI: https://doi.org/10.12799/rcphn.2023.00381
Published online: February 29, 2024
1Ph.D. Student, College of Nursing, Seoul National University, Seoul, Korea
2Professor, Department of Family medicine, Kyung Hee University Hospital, Seoul, Korea
3Professor, College of Nursing, Seoul National University ∙ Research Institute of Nursing Science, Seoul National University, Seoul, Korea
- Corresponding author: Ju Young Yoon College of Nursing and Research Institute of Nursing Science, Seoul National University, 103 Daehak-ro, Jongno-gu, Seoul 03080, Korea Tel: +82-2-740-8817, Fax: +82-2-741-5244, E-mail: yoon26@snu.ac.kr
© 2024 Korean Academy of Community Health Nursing
This is an Open Access article distributed under the terms of the Creative Commons Attribution NoDerivs License. (http://creativecommons.org/licenses/by-nd/4.0) which allows readers to disseminate and reuse the article, as well as share and reuse the scientific material. It does not permit the creation of derivative works without specific permission.
- 1,029 Views
- 24 Download
Abstract
-
Purpose
- Depression and frailty are common health problems that occur separately or simultaneously in later life. The two syndromes are correlated, but they need to be distinguished to promote successful aging. Previous studies have examined the reciprocal relationship between depression and frailty, but there are limitations in the methods or statistical analysis. This study aims to confirm the potential prospective bidirectional and causal relationship between depression and frailty.
-
Methods
- We used data from 887 older adults aged 70 to 84 from the Korean Frailty and Aging Cohort Study (KFACS) in 2016, 2018, and 2020 (3 waves). We separated the within-individual process from the stable between-individual differences using the random intercepts cross-lagged panel model.
-
Results
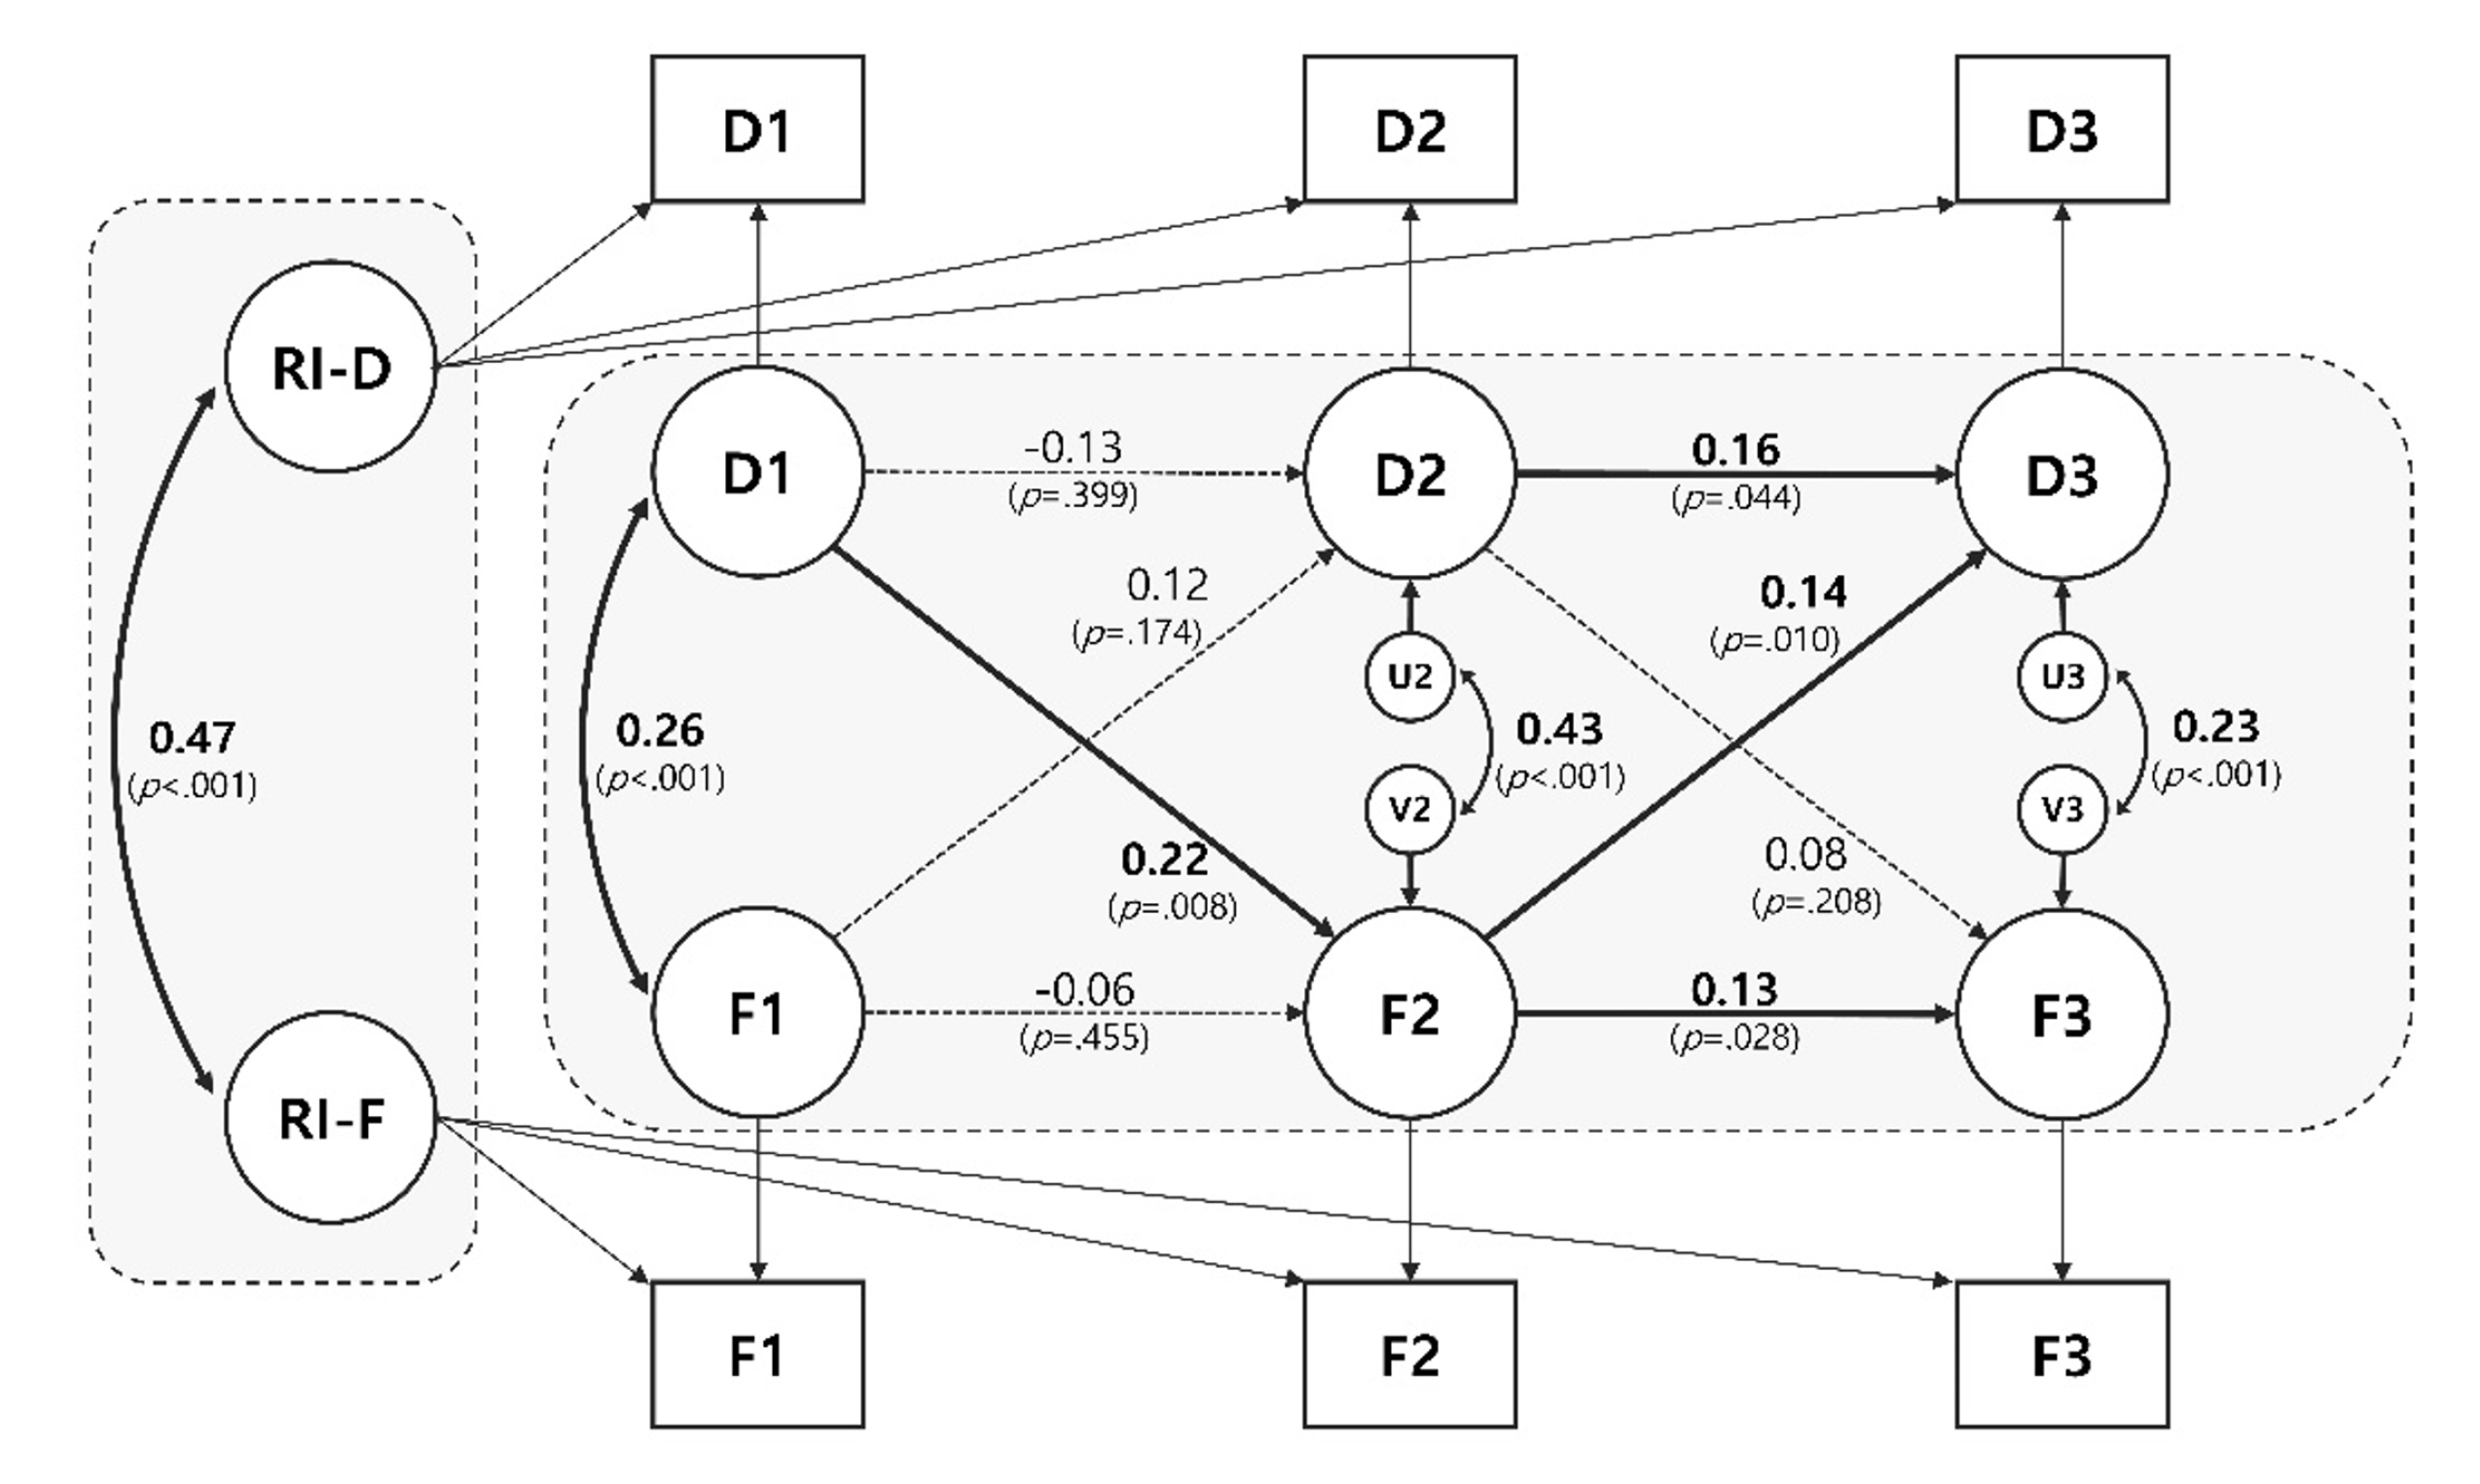
- Significant bidirectional causal effects were observed in 2 paths. Older adults with higher depression than their within-person average at T1 had a higher risk of frailty at T2 (β=.22, p=.008). Subsequently, older adults with higher-than-average frailty scores at T2 showed higher depression at T3 (β=.14, p=.010). Autoregressive effects were only significant from T2 to T3 for both constructs (Depression: β=.16, p=.044; Frailty: β=.13, p=.028). At the between-person level, the correlation was significant between the random intercepts between depression and frailty (β=.47, p<.001).
-
Conclusions
- We find that depressed older adults have an increased risk of frailty, which contributes to the onset of depression and the maintenance of frailty. Therefore, interventions for each condition may prevent the entry and worsening of the other condition, as well as prevent comorbidity.
- Older adults experience a number of physical and psychological difficulties during the aging process. Among them, depression and frailty are common health problems, either separately or concurrently [1]. The two syndromes have a similar prevalence of approximately 10-20% in older adults [2]. In South Korea, 13.5% of older adults suffer from late-life depression (LLD), which increases with age, reaching 24% among those aged 85 and older [3]. Older adults are more vulnerable to depressive symptoms due to the unique circumstances of later life such as health-related problems, retirement, loss of social contact [4]. However, they tend not to express their feelings verbally, making it difficult to detect. Undiagnosed or untreated LLD can worsen depressive symptoms and lead to a risk of morbidity associated with decreased cognitive, physical, and social functioning [5].
- On the other hand, frailty is “a biologic syndrome in which vulnerable conditions occur when exposed to multiple stressors, resulting in reduced functioning of multiple physiological systems [6].” The prevalence of frailty in community-dwelling older adults varies by definition and population characteristics, but most studies show a prevalence of 26.8 to 62.8% for prefrailty and 5.9 to 17.4% for frailty [7]. In the context of aging, frailty is an important issue in gerontology as it is a composite measure of physiology, psychology, and functional aspects of older adults. Despite the variety of definitions and screening methods, frailty is a dynamic and reversible process, so exploring its determinants is crucial [8]. Both geriatric syndromes reduce quality of life (QOL) in later life and are significantly associated with adverse health outcomes such as falls, functional decline, hospitalization, and death [9,10].
- The relationship between depression and frailty has been referred to as an overlapping syndrome, due to similarities in risk factors, symptoms, outcomes, and even diagnostic criteria [11]. Several confirmatory factor analyses and latent class analyses have shown that the two syndromes are highly correlated but distinct constructs [11,12]. The relationship between depression and frailty has been consistently demonstrated to be mutually influenced by a number of shared pathophysiological mechanisms. However, the direction of causality is still inconsistent. A number of longitudinal studies have filled in the causal gaps left by cross-sectional designs [13]. However, many cohort studies have only two waves, limiting their overall causal dynamics [14,15]. Another recent study examining the relationship between depression and frailty at the within-individual level using six panel waves did not find a relevant cross-lagged effect, concluding that the two syndromes are related by common causes [16].
- As such, the causal relationship between depression and frailty is disputed, and studies in a variety of settings and methodologies continue to provide evidence. This is because the discovery of a precursor condition may delay the onset of the other condition it affects, and prevent the development of other comorbid health issues. Therefore, this study aims to systematically investigate the bidirectional and causal relationship between depression and frailty through multiple waves by applying the random intercepts cross-lagged panel model (RI-CLPM).
Introduction
- 1. Participants
- The data used in this study are from the Korean Frailty and Aging Cohort Study (KFACS), a longitudinal study of frailty in community-dwelling older adults. KFACS recruited 3,014 older adults aged 70-84 from 10 medical centers in different urban and rural areas in Korea. Each center recruited participants from a variety of settings such as local senior welfare centers, community health centers, and outpatient clinics using quota sampling stratified by age and sex. The baseline survey was conducted from May 2016 to November 2017 [17]. We studied in three waves with data followed up every two years after baseline: 2016 (T1; baseline), 2018 (T2; 1st follow-up), 2020 (T3; 2nd follow-up). Of the 1,559 older adults who volunteered to participate in the baseline survey, 656 with missing values for frailty were excluded. We further excluded individuals with an MMSE score of less than 18 (n=16), which is considered severe cognitive decline [18], as the symptomatology of low cognitive level and depression may overestimate the impairment of mood and frail status [19]. Therefore, the total number of study participants was 887. Ethical approval for the study was obtained from the Institutional Review Board of Seoul National University(IRB No. E2301/003-005).
- 2. Variables
- Frailty was defined according to Fried 's phenotype in the Cardiovascular Health Study (CHS) [6]. It consists of five components, with one point assigned for each corresponding factor: (i) For unintentional weight loss, participants were asked “In the last year, have you lost more than 4.5 kg unintentionally?” (1 point was given for ‘yes’ to the question). (ii) Exhaustion was assessed by asking questions from the Center for Epidemiological Studies Depression (CES-D) scale on three or more days per week: “I felt that everything I did was an effort” and “I could not get going.” (1 point was given for ‘yes’ to either question) [20]. (iii) Weakness is the maximal grip strength after measuring twice for each hand using a hand grip dynamometer (T.K.K.5401; Takei Scientific Instruments Co, Tokyo, Japan) (1 point was given for strength of less than 26 kg for males and 18 kg for females) [21]. (iv) Slow walking speed was measured by walking 4m twice, with acceleration and deceleration phase of 1.5m. (1 point was given if the average speed value was less than 0.8 m/s) [21]. (v) Physical activity levels were measured using the International Physical Activity Questionnaire (IPAQ) by asking about the duration and frequencies of exercise over the past week [22]. The total number of minutes of physical activity in a week was multiplied by the metabolic equivalent of task (MET) value and categorized as high, moderate, or low according to the proposed IPAQ scoring protocol (https://sites.google.com/view/ipaq/score). Participants with a score of 0 were classified as ‘robust’, a score of 1-2 as ‘prefrail’, and a score of 3-5 as ‘frail’. In this study, we defined frailty as a total score (range: 0 to 5).
- Depression was measured using the Geriatric Depression Scale-15 (GDS-15). Participants answered yes or no to 15 questions about current or recent depressive symptoms, and the scores ranged from 0 to 15 points. A score of 0 indicates normal, and a higher score indicates more severe depressive symptoms [23]. The internal consistency of GDS-15 for each wave was good (Cronbach's α=.82 in 2016, .86 in 2018, and .84 in 2020).
- 3. Statistical Analysis
- We analyzed the data using SPSS 28.0 (IBM Corp., Armonk, NY, USA) for a description of general characteristics, and Pearson’s correlation analysis of depression and frailty. Mplus version 8.8 software was used to estimate the autoregressive and cross-lagged effects of depression and frailty. Any further non-normality was corrected through the maximum likelihood estimator with robust standard errors (MLR).
- Traditionally, cross-lagged panel models (CLPM) have been used to explore prospective effects between constructs [24]. However, since the CLPM has mixed, within- and between-individual sources of variance, it may be ambiguous in terms of knowing whether the results of the model are derived from the within- or between-person effect, or a combination (mixed) path [25]. The RI-CLPM, an alternative to CLPM, separates longitudinal data into stable, trait-like between differences and time-specific, within-unit dynamics to investigate fluctuations in the lagged relations within units [26]. In other words, by adding a RI factor to CLPM, the factor load between the RI-factor and the measurement variable is fixed to 1, and the variance of the measurement variable is fixed to 0, so that the variance of the observation scores can be explained only by latent variables in between- and within-person effects [27].
Methods
Frailty
Depression
- Of the 887 people in this study, 48.3% (n=428) were male, and the average age was 75.60±3.75 years (Table 1). Descriptive statistics and prevalence of depression and frailty for each wave are described in Table 2. Depression and frailty had significantly positive correlations at all measurement points (Table 3).
- Figure 1 shows evidence of the association between within- and between-person effects between depression and frailty. First, a significant bidirectional effect was observed in cross-lagged pathways. Older adults with higher depression scores than their within-person average at T1 had a significantly higher risk of frailty at T2 (β=.22, p=.008). Subsequently, older adults with higher-than-average frailty scores at T2 showed higher-than-average depression scores at T3 (β=.14, p=.010). However, these effects were not observed in the other waves (FrailtyT1→DepressionT2; β=.12, p=.174, DepressionT2→FrailtyT3; β=.08, p=.208). Autoregressive effects were only significant from T2 to T3 for both constructs (DepressionT2→T3); β=.16, p=.044, FrailtyT2→T3); β=.13, p=.028). This finding indicates that if the depressive symptoms are higher than usual at T2, they tend to be continuously higher than usual at T3 (vice versa). Finally, at the between-person level, the correlation between the RIs between depression and frailty was significant (β=.47, p<.001), which indicates that older adults with higher levels of depression tended to also have higher frailty scores (vice versa). RI-CLPM including depression and frailty showed a good fit [28]: CFI =.99; TLI =.98; RMSEA =.04; SRMR =.01.
Results
- In this study, we found the significant (i) bidirectional and causal relationships between depression and frailty at the within-person level, (ii) autoregressive effect from T2 to T3, (iii) correlation between RIs at the between-person level in community-dwelling older adults aged 70-84 within three-wave RI-CLPM. The results of reciprocal causality between two syndrome are consistent with a systematic review and meta-analysis that found depression to be a risk factor for frailty and frailty to be a risk factor for depression (4.42 and 4.07 odds, respectively) [29], and a recent study that found a bidirectional causal relationship even after adjusting for potential confounders using multivariate Mendelian randomization analysis [30].
- Although the direction of causality is not yet consensus, our findings add to the evidence that LLD may affect frailty, which in turn contributes the development of subsequent depression and the maintenance of frailty. This direction of causality can be explained by a set of pathophysiology mechanisms shared by LLD and frailty in the context of aging. The elderly develop a chronic low-grade inflammatory phenotype at the cellular and molecular level, referred to as immunosenescence [31]. First of all, the age-related inflammatory process increases inflammatory markers in the blood, such as interleukin (IL)-1β, IL-6, tumor necrosis factor (TNF)-α and C-reactive protein (CRP), which increases vulnerability to depression. Peripheral inflammation also signals to the brain through various pathways, such as the vagus nerve, blood-brain barrier, and cytokine transport system, to cause major depressive disorder [32]. In addition, age-related medical conditions such as hypertension, diabetes, and musculoskeletal pain syndromes (at least partially) mediate pro-inflammatory processes, leading to increased allostatic load on the brain, resulting in regional atrophy, loss of white matter microstructure, and increased neuropathology that can contribute to new onset of depression [32]. In particular, increased IL-6 is known to weaken muscle mass and strength in the elderly, causing changes in motor function, fatigue, and a depressive affect [33]. Regardless of the inflammation hypothesis, LLD can lead to sedentary behavior, malnutrition, and sleep disorders, which in turn increases the risk of muscle atrophy, poor physical condition and the subsequent development of depression [34].
- However, the two significant causal effects were observed asymmetrically in different waves. The first of these results may be due to the characteristics of the RI-CLPM. According to the suggestion that time-dependent variables such as psychological and developmental processes should be analyzed longitudinally with multiple measures [35], this study applied RI-CLPM to isolate within-person effects in order to clarify the origin of the supposed causal relationship between the two syndromes. However, in RI-CLPM, as the number of assessments increases, the residualized scores repeatedly return to the trait level, which is commonly used to detect short-term or temporary cross-lagged effects [36]. In this respect, the relatively long time gap in this study may have been insufficient to detect a sustained-time lagged effect. Second, as mentioned above, the complex pathophysiologic interactions between the two syndromes and aging process may have confounded the results. In particular, the use of antidepressants, which was not investigated in KFACS, is a potential confounder for causality estimation. Age-related physiologic changes such as altered pharmacodynamics and pharmacokinetics, multimorbidity, and drug interactions due to polypharmacy can reduce the effectiveness of drugs or lead to unexpected consequences [37]. Depressed and frail elderly people have been reported to have a more attenuated response to antidepressants [38].
- The reciprocal relationship found in between-person stability can also be explained by pathophysiological mechanisms (trait-like) such as chronic inflammation, oxidative stress, immuno-metabolic dysregulation, mitochondrial dysfunction, and hypothalamic-pituitary-adrenal (HPA) axis dysregulation [39,40]. For example, if white matter lessions are anterior, they are susceptible to LLD [41], and if they are posterior, they affect motor control components of frailty such as grip strength, gait speed [42]. In addition, increased IL-6 in older adults with LLD reduces muscle mass and strength, causing motor slowing, fatigue, and depressive affects [43].
- On the other hand, the autoregressive effects were only significant from T2 to T3 for both syndromes. In RI-CLPM, since trait-like factors are captured by RIs, the autoregressive effect can be considered additional moment-to-moment stability (i.e., inertia or carry-over) of within unit fluctuations over time [27]. The reason why the autoregressive effect of both syndromes was not significant from T1 to T2 may be due to the dynamic nature of frailty and depression. According to a meta-analysis [33] of 16 cohort studies related to frailty transitions, changes were found an average of 3.9 years later in 40.6% of non-frail to frail group, 18.2% of prefrail to frail, and 3.3% of frail to non-frail. LLD, which is based on multifactorial etiologies, also has a variable trajectory with within-individual variation, particularly based on clinical attributes (e.g., initial onset of depression, length and number of depressive episodes) [44,45].
- However, there may have been no more significant fluctuations in depression and frailty status from T2 where the average age was over 77 years old. Ding et al.’s study [46] also found that people aged 75 and older with physical frailty had a lower increase (slope) in frailty scores over time. Depressive symptoms also tend to become more chronic with age, as remission time is delayed [47]. In other words, the carry-over effects of depression and frailty tend to change over time, but can eventually become chronic and stabilize due to ceiling effect.
- This study has several strengths. First, the way depression and frailty were defined in this study may increase the reliability of the findings. Frailty was assessed directly for physical deficits using Fried’s phenotype, the gold standard for measuring frailty in community-dwelling older adults [48]. Also, to minimize the risk of phenomenological overlap with depression, which has similar diagnostic criteria, depression was defined using the GDS-15, which does not include somatic symptoms. Second, as most studies in this context have been conducted on populations in western countries [13], this study can provide new evidence for individuals in a similar settings to the Korean elderly. Nevertheless, this study has some limitations. First, of the 1,559 participants in the KFACS baseline, there were a number of dropouts (n=656, 42%) due to the burden of frailty measurement. However, the general characteristics of the baseline participants and dropouts were not statistically different, so the generalizability of the results should not be compromised. Second, due to the use of secondary data and limitations of methodology, we were unable to fully adjust for multidimensional covariates that could potentially interfere with the causal relationship between the two constructs.
Discussion
- This study confirms that older adults with depression are at increased risk for frailty, which may contribute to the development of new depression and the maintenance of frailty. Therefore, early detection and intervention for each condition may prevent entry into and exacerbation of the other condition, thus preventing the comorbidity of depression and frailty.
Conclusions
-
Conflict of interest
Ju Young Yoon has been editorial board member of the Research in Community and Public Health Nursing. She was not involved in the review process of this manuscript. No conflict of interest has been declared by all authors.
-
Funding
This work was supported by the student research grant from the Research Institute of Nursing Science, Seoul National University in 2022, funded by Basic Science Research Program through the National Research Foundation of Korea (NRF) funded by the Ministry of Education (No. 2022R1I1A207290712).
-
Authors’ contributions
Ji Hye Shin contributed to conceptualization, data curation, formal analysis, funding acquisition, methodology, writing – original draft, review & editing, investigation, and software. Gyeong A Kang contributed to funding acquisition, methodology, writing – review & editing, resources, software, and validation. Sun Young Kim contributed to data curation, resources, and writing – review & editing. Won Chang Won contributed to data curation, project administration, resources, and writing – review & editing. Ju Young Yoon contributed to conceptualization, formal analysis, methodology, project administration, writing – review & editing, investigation, resources, supervision, and validation.
-
Data availability
Data can be obtained after applying and being approved by following the procedures guided on the Korean Frailty Aging Cohort Study (http://www.kfacs.kr). More details on the data collection process are available (https://doi.org/10.1136/bmjopen-2019-035573).
NOTES
Acknowledgments

MMSE=mini-mental state examination; MNA=mini-nutritional assessment.
†Number of comorbidities; self-reported physician-diagnosis of hypertension, myocardial infarction, dyslipidemia, diabetes mellitus, congestive heart failure, angina pectoris, peripheral vascular disease, cerebrovascular disease, osteoarthritis, rheumatoid arthritis, asthma, and chronic obstructive pulmonary disease [49].
- 1. Nascimento PPPd, Batistoni SST. Depression and frailty in old age: A narrative review of the literature published between 2008 and 2018. Interface-Comunicação, Saúde, Educação. 2019;23:e180609. https://doi.org/10.1590/Interface.180609Article
- 2. Rodda J, Walker Z, Carter J. Depression in older adults. BMJ. 2011;343:d5219. https://doi.org/10.1136/bmj.d5219ArticlePubMed
- 3. Ministry of Health and Welfare. 2020 Survey on older adults in South Korea [Internet]. Seoul: Ministry of Health and Welfare. 2021 [cited 2023 Dec 6]. Available from: https://www.mohw.go.kr/board.es?mid=a10411010100&bid=0019&act=view&list_no=366496
- 4. Thapa DK, Visentin DC, Kornhaber R, Cleary M. Prevalence and factors associated with depression, anxiety, and stress symptoms among older adults: A cross‐sectional population‐based study. Nursing & Health Sciences. 2020;22(4):1139–1152. https://doi.org/10.1111/nhs.12783ArticlePubMed
- 5. Balsamo M, Cataldi F, Carlucci L, Padulo C, Fairfield B. Assessment of late-life depression via self-report measures: a review. Clinical Interventions in Aging. 2018;13:2021–2044. https://doi.org/10.2147/CIA.S178943ArticlePubMedPMC
- 6. Fried LP, Tangen CM, Walston J, Newman AB, Hirsch C, Gottdiener J, et al. Frailty in older adults: evidence for a phenotype. The Journals of Gerontology Series A: Biological Sciences and Medical Sciences. 2001;56(3):M146–M157. https://doi.org/10.1093/gerona/56.3.M146ArticlePubMed
- 7. He B, Ma Y, Wang C, Jiang M, Geng C, Chang X, et al. Prevalence and risk factors for frailty among community-dwelling older people in China: A systematic review and meta-analysis. The journal of Nutrition, Health & Aging. 2019;23(5):442–450. https://doi.org/10.1007/s12603-019-1179-9ArticlePubMed
- 8. Kwak D, Thompson LV. Frailty: Past, present, and future? Sports Medicine and Health Science. 2021;3(1):1–10. https://doi.org/10.1016/j.smhs.2020.11.005ArticlePubMedPMC
- 9. Hussenoeder FS, Jentzsch D, Matschinger H, Hinz A, Kilian R, Riedel-Heller SG, et al. Depression and quality of life in old age: A closer look. European Journal of Ageing. 2021;18:75–83. https://doi.org/10.1007/s10433-020-00573-8ArticlePubMedPMC
- 10. Chu W, Chang SF, Ho HY. Adverse health effects of frailty: Systematic review and meta‐analysis of middle‐aged and older adults with implications for evidence‐based practice. Worldviews on Evidence‐Based Nursing. 2021;18(4):282–289. https://doi.org/10.1111/wvn.12508ArticlePubMed
- 11. Mezuk B, Lohman M, Dumenci L, Lapane KL. Are depression and frailty overlapping syndromes in mid-and late-life? A latent variable analysis. The American Journal of Geriatric Psychiatry. 2013;21(6):560–569. https://doi.org/10.1016/j.jagp.2012.12.019ArticlePubMedPMC
- 12. Lohman M, Dumenci L, Mezuk B. Depression and frailty in late life: evidence for a common vulnerability. Journals of Gerontology Series B. 2016;71(4):630–640. https://doi.org/10.1093/geronb/gbu180ArticlePubMedPMC
- 13. Chu W, Chang SF, Ho HY, Lin HC. The relationship between depression and frailty in community‐dwelling older people: A systematic review and meta‐analysis of 84,351 older adults. Journal of Nursing Scholarship. 2019;51(5):547–559. https://doi.org/10.1111/jnu.12501ArticlePubMed
- 14. Marconcin P, Barak S, Ferrari G, Gouveia ÉR, de Maio Nascimento M, Willig R, et al. Prevalence of frailty and its association with depressive symptoms among european older adults from 17 countries: A 5-year longitudinal study. International Journal of Environmental Research and Public Health. 2022;19(21):14055. https://doi.org/10.3390/ijerph192114055ArticlePubMedPMC
- 15. Wang X, Shen K. The reciprocal relationship between frailty and depressive symptoms among older adults in rural China: A cross-lag analysis. Healthcare. 2021;9(5):593. https://doi.org/10.3390/healthcare9050593ArticlePubMedPMC
- 16. Mayerl H, Stolz E, Freidl W. Frailty and depression: Reciprocal influences or common causes? Social Science & Medicine. 2020;263:113273. https://doi.org/10.1016/j.socscimed.2020.113273Article
- 17. Won CW, Lee S, Kim J, Chon D, Kim S, Kim CO, et al. Korean frailty and aging cohort study (KFACS): cohort profile. BMJ open. 2020;10(4):e035573. https://doi.org/10.1136/bmjopen-2019-035573ArticlePubMedPMC
- 18. Shrestha K, Ojha SP, Dhungana S, Shrestha S. Depression and its association with quality of life among elderly: An elderly home-cross sectional study. Neurology, Psychiatry and Brain Research. 2020;38:1–4. https://doi.org/10.1016/j.npbr.2020.08.003Article
- 19. Maștaleru A, Abdulan IM, Ștefăniu R, Lefter N, Sandu IA, Pîslaru AI, et al. Relationship between frailty and depression in a population from North-Eastern Romania. International Journal of Environmental Research and Public Health. 2022;19(9):5731. https://doi.org/10.3390/ijerph19095731ArticlePubMedPMC
- 20. Orme JG, Reis J, Herz EJ. Factorial and discriminant validity of the Center for Epidemiological Studies Depression (CES‐D) scale. Journal of Clinical Psychology. 1986;42(1):28–33. https://doi.org/10.1002/1097-4679(198601)42:1<28::AID-JCLP2270420104>3.0.CO;2-TArticlePubMed
- 21. Chen LK, Liu LK, Woo J, Assantachai P, Auyeung TW, Bahyah KS, et al. Sarcopenia in Asia: consensus report of the Asian Working Group for Sarcopenia. Journal of the American Medical Directors Association. 2014;15(2):95–101. https://doi.org/10.1016/j.jamda.2013.11.025ArticlePubMed
- 22. Craig CL, Marshall AL, Sjöström M, Bauman AE, Booth ML, Ainsworth BE, et al. International physical activity questionnaire: 12-country reliability and validity. Medicine & Science in Sports & Exercise. 2003;35(8):1381–1395. https://doi.org/10.1249/01.MSS.0000078924.61453.FBArticlePubMed
- 23. Yesavage JA. Geriatric depression scale. Psychopharmacol bull. 1988;24(4):709–711. PubMed
- 24. Finkel SE. Causal analysis with panel data. Sage; 1995. 24 p.
- 25. Usami S, Hayes T, McArdle JJ. Inferring longitudinal relationships between variables: Model selection between the latent change score and autoregressive cross-lagged factor models. Structural Equation Modeling: A Multidisciplinary Journal. 2016;23(3):331–342. https://doi.org/10.1080/10705511.2015.1066680Article
- 26. Hamaker EL, Kuiper RM, Grasman RP. A critique of the cross-lagged panel model. Psychological Methods. 2015;20(1):102–116. https://doi.org/10.1037/a0038889ArticlePubMed
- 27. Mulder JD, Hamaker EL. Three extensions of the random intercept cross-lagged panel model. Structural Equation Modeling: A Multidisciplinary Journal. 2021;28(4):638–648. https://doi.org/10.1080/10705511.2020.1784738Article
- 28. Hu Lt, Bentler PM. Cutoff criteria for fit indexes in covariance structure analysis: Conventional criteria versus new alternatives. Structural Equation Modeling: A Multidisciplinary Journal. 1999;6(1):1–55. https://doi.org/10.1080/10705519909540118Article
- 29. Soysal P, Veronese N, Thompson T, Kahl KG, Fernandes BS, Prina AM, et al. Relationship between depression and frailty in older adults: a systematic review and meta-analysis. Ageing Research Reviews. 2017;36:78–87. https://doi.org/10.1016/j.arr.2017.03.005ArticlePubMed
- 30. Sang N, Li BH, Zhang MY, Wei M, Fang RX, Liu WJ, et al. Bidirectional causal relationship between depression and frailty: a univariate and multivariate Mendelian randomisation study. Age and Ageing. 2023;52(7):afad113. https://doi.org/10.1093/ageing/afad113ArticlePubMed
- 31. Leng SX, Margolick JB. Aging, sex, inflammation, frailty, and CMV and HIV infections. Cellular Immunology. 2020;348:104024. https://doi.org/10.1016/j.cellimm.2019.104024ArticlePubMedPMC
- 32. Majd M, Saunders EFH, Engeland CG. Inflammation and the dimensions of depression: a review. Frontiers in Neuroendocrinology. 2020;56:100800. https://doi.org/10.1016/j.yfrne.2019.100800ArticlePubMed
- 33. Brown PJ, Rutherford BR, Yaffe K, Tandler JM, Ray JL, Pott E, et al. The depressed frail phenotype: the clinical manifestation of increased biological aging. The American Journal of Geriatric Psychiatry. 2016;24(11):1084–1094. https://doi.org/10.1016/j.jagp.2016.06.005ArticlePubMedPMC
- 34. Deng MG, Liu F, Liang Y, Wang K, Nie JQ, Liu J. Association between frailty and depression: A bidirectional Mendelian randomization study. Science Advances. 2023;9(38):eadi3902. https://doi.org/10.1126/sciadv.adi3902ArticlePubMedPMC
- 35. Hajek A, Brettschneider C, Posselt T, Lange C, Mamone S, Wiese B, et al. Predictors of frailty in old age–results of a longitudinal study. The Journal of Nutrition, Health & Aging. 2016;20(9):952–957. https://doi.org/10.1007/s12603-015-0634-5ArticlePubMed
- 36. Orth U, Clark DA, Donnellan MB, Robins RW. Testing prospective effects in longitudinal research: Comparing seven competing cross-lagged models. Journal of Personality and Social Psychology. 2021;120(4):1013–1034. https://doi.org/10.1037/pspp0000358ArticlePubMedPMC
- 37. Gutsmiedl K, Krause M, Bighelli I, Schneider-Thoma J, Leucht S. How well do elderly patients with major depressive disorder respond to antidepressants: a systematic review and single-group meta-analysis. BMC Psychiatry. 2020;20(1):102. https://doi.org/10.1186/s12888-020-02514-2ArticlePubMedPMC
- 38. Brown PJ, Ciarleglio A, Roose SP, Garcia CM, Chung S, Alvarez J, et al. Frailty worsens antidepressant treatment outcomes in late life depression. The American Journal of Geriatric Psychiatry. 2021;29(9):944–955. https://doi.org/10.1016/j.jagp.2020.12.024ArticlePubMedPMC
- 39. Pilotto A, Custodero C, Maggi S, Polidori MC, Veronese N, Ferrucci L. A multidimensional approach to frailty in older people. Ageing Research Reviews. 2020;60:101047. https://doi.org/10.1016/j.arr.2020.101047ArticlePubMedPMC
- 40. Kuo C-Y, Lin C-H, Lane H-Y. Molecular basis of late-life depression. International Journal of Molecular Sciences. 2021;22(14):7421. https://doi.org/10.3390/ijms22147421ArticlePubMedPMC
- 41. Lin C, Huang CM, Karim HT, Liu HL, Lee TM-C, Wu CW, et al. Greater white matter hyperintensities and the association with executive function in suicide attempters with late-life depression. Neurobiology of Aging. 2021;103:60–67. https://doi.org/10.1016/j.neurobiolaging.2020.12.016ArticlePubMed
- 42. Ducca EL, Gomez GT, Palta P, Sullivan KJ, Jack Jr CR, Knopman DS, et al. Physical frailty and brain white matter abnormalities: The atherosclerosis risk in communities study. The Journals of Gerontology: Series A. 2023;78(2):357–364. https://doi.org/10.1093/gerona/glac111ArticlePubMedPMC
- 43. Kojima G, Taniguchi Y, Iliffe S, Jivraj S, Walters K. Transitions between frailty states among community-dwelling older people: a systematic review and meta-analysis. Ageing Research Reviews. 2019;50:81–88. https://doi.org/10.1016/j.arr.2019.01.010ArticlePubMed
- 44. Jellinger KA. The heterogeneity of late-life depression and its pathobiology: a brain network dysfunction disorder. Journal of Neural Transmission. 2023;130:1057–1076. https://doi.org/10.1007/s00702-023-02648-zArticlePubMedPMC
- 45. Ly M, Karim HT, Becker JT, Lopez OL, Anderson SJ, Aizenstein HJ, et al. Late-life depression and increased risk of dementia: a longitudinal cohort study. Translational Psychiatry. 2021;11:147. https://doi.org/10.1038/s41398-021-01269-yArticlePubMedPMC
- 46. Ding YY, Kuha J, Murphy M. Multidimensional predictors of physical frailty in older people: identifying how and for whom they exert their effects. Biogerontology. 2017;18:237–252. https://doi.org/10.1007/s10522-017-9677-9ArticlePubMedPMC
- 47. Alexopoulos GS. Mechanisms and treatment of late-life depression. Translational Psychiatry. 2019;9(1):188. https://doi.org/10.1038/s41398-019-0514-6ArticlePubMedPMC
- 48. Choi J, Ahn A, Kim S, Won CW. Global prevalence of physical frailty by Fried's criteria in community-dwelling elderly with national population-based surveys. Journal of the American Medical Directors Association. 2015;16(7):548–550. https://doi.org/10.1016/j.jamda.2015.02.004ArticlePubMed
- 49. Lee S, Kim M, Lee Y, Kim J, Jang HC, Cho B, et al. The effect of sex and physical frailty on incident disability after 2 years among community-dwelling older adults: KFACS study. BMC geriatrics. 2022;22:588. https://doi.org/10.1186/s12877-022-03263-5ArticlePubMedPMC
 PubReader
 ePub Link
 Cite
Cite