Articles
- Page Path
- HOME > Res Community Public Health Nurs > Volume 35(1); 2024 > Article
-
Original Article
- Urban-Rural Differences in Prevalence of Depressive Symptoms and Its Related Factors Among Older Adults: Findings from the Korean Longitudinal Study of Aging
-
Bongjeong Kim1
 , Jinseub Hwang2, Dohyang Kim3, Soo Jin Kang4
 -
Research in Community and Public Health Nursing 2024;35(1):51-63.
DOI: https://doi.org/10.12799/rcphn.2023.00388
Published online: March 29, 2024
1Associate Professor, Department of Nursing, Cheongju University, Chungbuk, Korea
2Professor, Department of Statistics, Daegu University, Gyeongsan, Korea
3Ph.D. Candidate, Department of Statistics, Daegu University, Gyeongsan, Korea
4Associate Professor, Department of Nursing, Daegu University, Daegu, Korera
- Corresponding author: Soo Jin Kang Department of Nursing, Daegu University, 50 Gil-54, Seongdang-ro, Nam-gu, Daegu 38453, Korea Tel: +82-53-650-8393, Fax: +82-53-650-8389, E-mail: kangsj@daegu.ac.kr
© 2024 Korean Academy of Community Health Nursing
This is an Open Access article distributed under the terms of the Creative Commons Attribution NoDerivs License. (http://creativecommons.org/licenses/by-nd/4.0) which allows readers to disseminate and reuse the article, as well as share and reuse the scientific material. It does not permit the creation of derivative works without specific permission.
- 1,261 Views
- 12 Download
Abstract
-
Purpose
- Many studies exist on factors associated with depressive symptoms in urban and rural older adults; however, studies using a longitudinal design are scarce. This study aimed to determine whether there is a difference in the prevalence of depressive symptoms and their associated risk factors over time between urban and rural areas using a longitudinal sample of Korean older adults.
-
Methods
- Data from the Korean Longitudinal Study of Aging (2006–2020) of older adult participants ≥65 years without depressive symptoms were analyzed. A generalized estimating equation model was employed for repeated measures analysis.
-
Results
- As the time of living in the area increased, the prevalence risk of depressive symptoms in older adults increased in urban areas compared to rural areas in adjusted Model 2. In urban areas, less social contact with neighbors was significantly associated with a higher risk of depressive symptoms. In rural areas, occasional social contact with children was significantly associated with a lower risk of depressive symptoms. The prevalence of depressive symptoms was associated with five components of successful aging with some variations observed based on urban and rural residential areas.
-
Conclusions
- Our findings suggest that understanding the longitudinal impact of residence on depressive symptoms provides valuable insights into the relationship between urban/rural areas and depressive symptoms. This study highlights the need for nursing intervention efforts aimed at promoting successful aging and increasing social contact with children or neighbors.
- Depression in old age is a common mental disorder that affects health-related quality of life [1,2]. Due to rapid population aging, the prevalence of depressive symptoms among the older population is continuously increasing. Globally, approximately 5.7% of adults aged >60 years suffer from depression [3]. Moreover, 10–15% of older adults have clinically significant depressive symptoms [1]. The prevalence of depressive symptoms in older adults in Korea is estimated to be 13.5% in those aged >65 years and 24.0% in those >85 years [4]. Depression among older adults increases the risk of physical health problems, suicide, and mortality, and reduces cognitive functioning [5,6]; therefore, it has been widely recognized as a public health priority.
- Depression in old age is primarily influenced by the features of neighborhoods or residential environments where older people live rather than individual-level characteristics [6-8]. In particular, because the place of residence varies greatly by socioeconomic status, urban/rural residential areas could be important contributors to health disparities [9]. Although the differences in the physical health of older adults between urban and rural areas have been studied extensively, relatively little attention has been paid to the differences in their mental health [6].
- Previous studies have reported that urban and rural residential areas have different effects (positive or negative) on mental health aspects, such as depression and depressive symptoms [9,10]. A systematic review and meta-analysis study [6] found that depression prevalence was significantly higher among urban residents than among the rural ones in developed countries, whereas in developing countries, including China and Myanmar, depression prevalence was higher in most rural areas than in urban areas [6,11,12]. Previous studies in Korea have also reported a higher prevalence of depressive symptoms in urban older people [13] and a higher prevalence of depressive symptoms in rural areas [14-16]. In some studies, the prevalence of depressive symptoms in older adults was not significantly different between urban and rural areas [17,18]. The regional differences can be attributed to the fact that rural population generally have a relatively lower socioeconomic status and more limited access to healthcare resources, as well as social, and environmental resources, compared to the urban one [11,16]. Due to their differences in characteristics, it is necessary to distinguish between urban and rural areas when investigating the variations in depressive symptoms for effective nursing interventions.
- Most of previous research has examined the association between residential areas and such symptoms in older adults using cross-sectional designs; thus, the findings have been limited in identifying consistent associations [6,11,12]. Therefore, it is of great necessity to study whether there are regional differences in the evolution of depressive symptoms using longitudinal data.
- Recently, among the (individual) factors related to depressive symptoms in older adults, successful aging (SA) and social relationships have attracted attention as possible intervention factors. SA has become a crucial concept for describing the quality of aging and is a multidimensional concept encompassing physiological, social, and psychological health domains [19]. Prior studies have reported a relationship between SA and depression [20-22] and in a Korean study, unsuccessful aging predicted a higher risk of depressive symptoms [23]. Lack of or insufficient social contact with neighbors or children is related to depressive symptoms [24,25], and there are differences in access to essential social support resources between urban and rural areas. Although these studies provide important information on the predictors of depressive symptoms, studies using a longitudinal design are scarce.
- Therefore, this study aimed to identify whether there is a difference in the urban/rural prevalence and risk factors of depressive symptoms over time using a longitudinal sample of Korean older adults. The findings provide evidence for the need of appropriate community-based nursing interventions to prevent depression in older adults living in residential areas with different characteristics.
Introduction
- 1. Study Design and Participants
- This was a secondary data analysis study using longitudinal data. Data were derived from the first to the eighth wave of the Korean Longitudinal Study of Aging (KLoSA) from 2006–2020, which is an ongoing, large-scale longitudinal study by the Korea Labor Institute that uses multistage stratified probability sampling of Korean residents aged ≥45 years. Nationally representative panel data were collected [26].
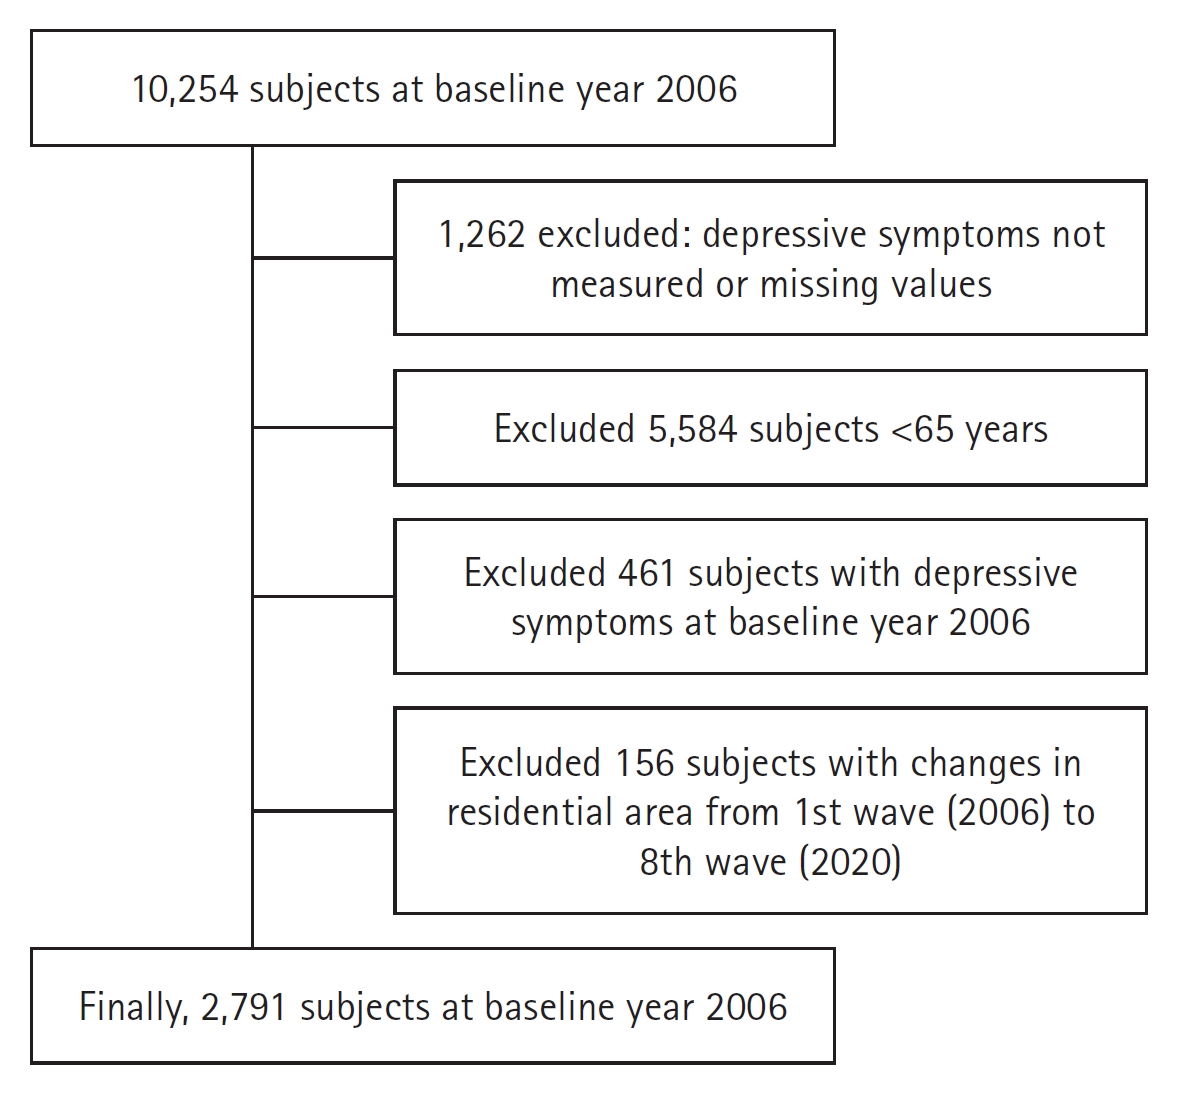
- This study included a sample of adults aged ≥65 years. In the baseline data from 2006, 10,254 individuals were surveyed. We excluded those with missing data (n=1,262) and participants below 65 years of age (n=5,584). Among the 3,408 respondents, 617 were excluded because of depressive symptoms (n=461) or changes in residence (n=156). Our final baseline sample comprised 2,791 participants. To confirm the effect of residence over time, those who moved between urban and rural residential areas were excluded during the survey period. Figure 1 presents the flowchart of the participants and the selection process.
- 2. Measurements
- Depressive symptoms were assessed using the Korean version of the Center for Epidemiologic Studies Depression Scale (CES-D 10). The CES-D 10 comprises 10 items listed in the original 20-item version with scores ranging from 0–10, where higher scores indicate more severe depressive symptoms [27,28]. We used a recommended cutoff score of four points for older adults to indicate depressive symptoms at baseline, which is considered sufficient to diagnose clinically relevant depression in older adults [28,29]. Depressive symptoms were classified into two categories (1=yes, 0=no, meaning present and, respectively absent).
- Urban and rural areas were identified according to the administrative divisions of South Korea. Urban areas were defined as metropolitan cities and small and medium cities with “dong” (neighborhood) unit districts, while rural areas were defined as provinces made up of “eup” (township) and “myeon” (town) unit districts.
- Social contact was measured by the frequency of meetings with own children and neighbors. Social contact with children was categorized as “frequently meets at least one child,” “frequently meets all the children,” “occasionally meets all the children,” or “rarely meets all the children.” Social contact with neighbors was categorized as “meets with neighbors more than once a week” or “meets with neighbors less than once a week.”
- The following five components were used to assess SA: 1) absence of chronic disease, 2) no disability, 3) high cognitive function, 4) active social engagement, and 5) satisfaction with life [30,31]. The first component refers to chronic diseases that are the primary causes of death in Korea (cancer, heart disease, chronic lung disease, diabetes mellitus, and cerebrovascular disease), with a total count ranging between 0–5. Based on respondents’ self-reports of previously diagnosed diseases, SA was defined as the absence of all these five diseases [32]. Disability was evaluated by reference to activities of daily living (ADL) and instrumental activities of daily living (IADL) [23,32]. Successful agers included respondents without difficulties in ADL and with no more than one disability in IADL. Cognitive function was evaluated using the Korean version of the Mini-Mental State Examination (MMSE-K). The MMSE-K scores range between 0–30, and respondents with a score of ≥24 were classified as achieving SA [23,32]. Active social engagement was assessed by participation in social activities, including religious, leisure/sports, alumni, volunteering, and political and nongovernmental organizations [23,32]. Successful agers had to participate in at least one of these activities. Satisfaction with life was measured as satisfaction with health, economic status, marital status, relationships with children, and general satisfaction in later life on a scale of 0–100 [32].
- Respondents with a mean score of ≥60 were classified as achieving SA [33]. Overall, participants who satisfied all five conditions were classified under SA.
- Control variables included sex, age (65–74, 75–84, or ≥85 years), marital status (married or unmarried), education level (elementary or lower, middle school, high school, college, or higher), household income level (low, low-middle, middle-high, high), medical insurance type (national, medical aid), economic activity (active or inactive), health behaviors, vision (good or poor), and hearing ability (good or poor). Health behaviors included smoking (current/past/never), alcohol consumption (yes/no), physical activity (yes/no), regular diet (yes/no), and body mass index (BMI), which was calculated using a person’s height and weight, and accordingly, participants were categorized as underweight (<18.5 g/m2), normal weight (18.5–25 g/m2), or obese (>25 g/m2). Relevant physical activity was considered at least once a week and was assessed with response options of “yes” and “no.”
- 3. Statistical analysis
- Baseline differences between the characteristics of the respondents by residential area (urban or rural) were determined using a chi-square test. Eight waves (2006–2020) were used for the analysis and repeated measurements were performed for each individual up to seven times. We determined the prevalence of depressive symptoms by residence from 2008 to 2020. Considering the longitudinal nature of our data, a generalized estimating equation (GEE) model was employed for repeated-measures analysis, and a lag function was applied to determine whether depressive symptoms were present or absent in the previous and following years.
- Using GEE logistic regression, we examined the combined effects of changes in time and other covariates on depressive symptoms. In Model 1 (unadjusted), independent and other variables were not included, and the prevalence of depressive symptoms according to residence and time change was identified. In Model 2, the adjusted effect was identified by adding SA, social contact with children and neighbors, and the control variables to Model 2. The effects of residential area and time on depressive symptoms were identified using an interaction term. In Model 2, the effects of time change, residential area, and time change × residential area on the prevalence of depressive symptoms were analyzed after controlling for the control variables. A subgroup analysis (rural versus urban) was performed to identify differences in factors related to depressive symptoms by residential area. All statistical analyses were performed using SAS version 9.4 (SAS Institute Inc., Cary, NC, USA), and a p-value <0.05 was considered statistically significant.
- 4. Ethical statement
- The original data are publicly available free of charge from the KLoSA website, published by the Korea Employment Information Service. This study used a deidentified secondary dataset. Therefore, it was exempted from review by Institutional Review Board of Cheongju University (No. 1040621-202202-HR-E001).
Methods
Depressive symptoms
Residential areas
Social contact
Successful aging
Control variables
- 1. Baseline characteristics of the study population by urban and rural areas
- Table 1 presents the descriptive statistics and differences in the distribution of the study variables by urban and rural areas at baseline. A total of 2,791 older adults without depressive symptoms were included (urban=1,961, rural=830). Of the participants, 46.43% were men and 53.57% were women. The percentage of participants aged 65–74 was 67.97%. Approximately 68.94% of all participants had an education level below elementary school, 42.06% had a high household income, and 80.08% were economically inactive. There were significant differences between urban and rural areas in all variables except for sex, age, medical insurance type, hearing, and vision.
- 2. Changes in the prevalence of depressive symptoms according to survey periods
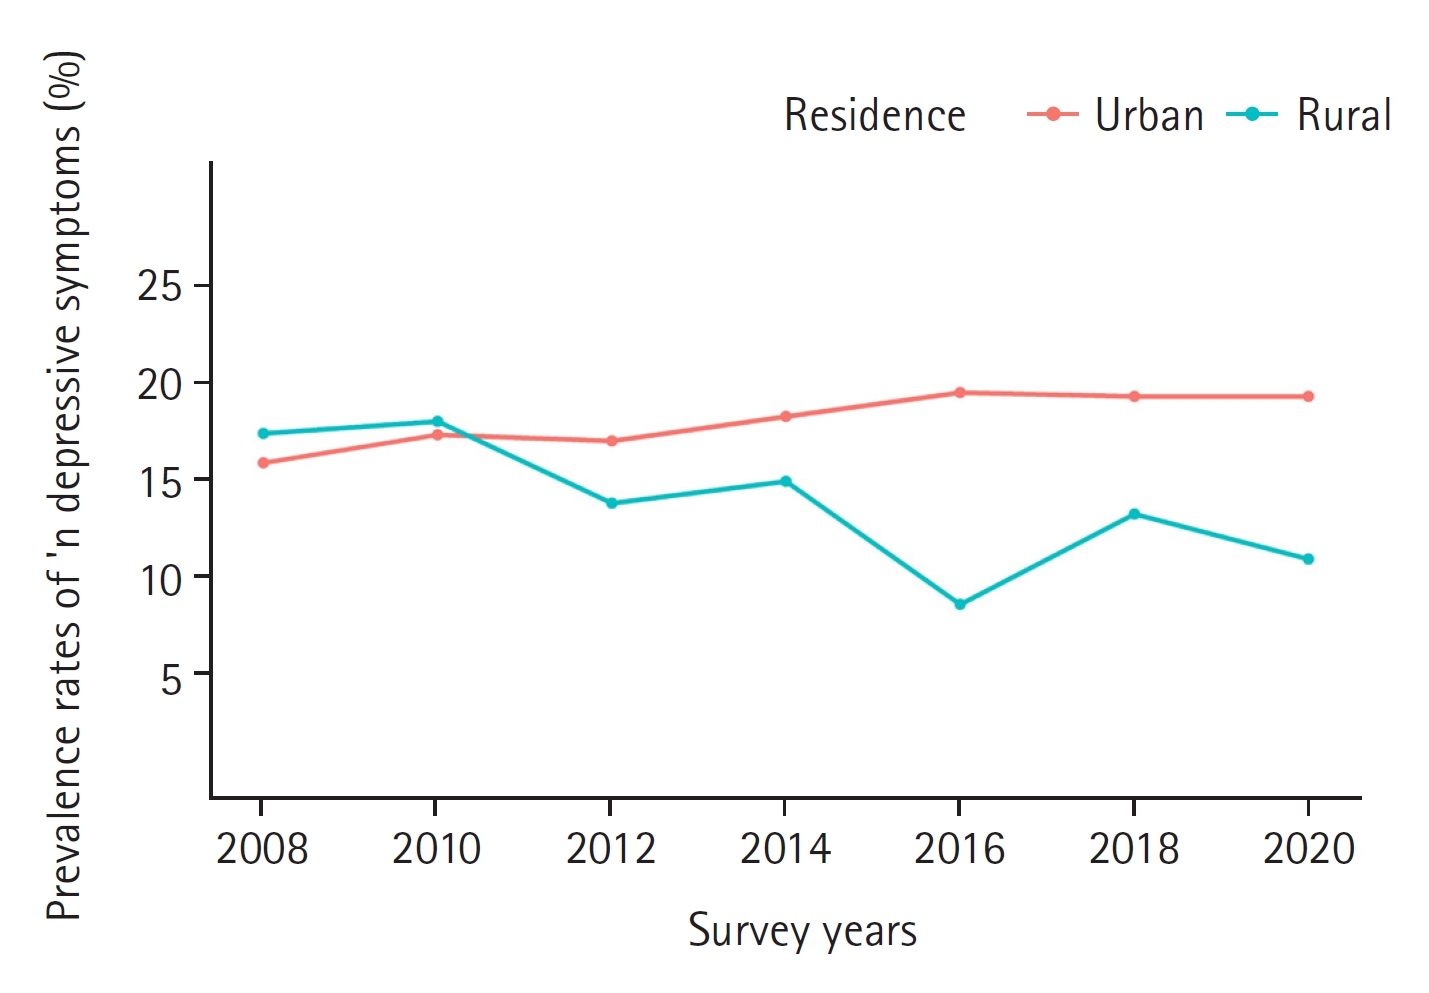
- Figure 2 shows the differences in the prevalence of depressive symptoms between urban and rural areas from the second (2008) to the eighth wave (2020). In 2008, the prevalence of depressive symptoms was higher in rural areas (17.10%) than in the urban ones (15.64%). Over the following decade, there have been some shifts in prevalence rates. In urban areas, the prevalence of depressive symptoms increased from 17.16% in 2010 to 19.30% in 2020. Contrastingly, the prevalence of depressive symptoms in rural areas decreased from 18.19% in 2010 to 10.89% in 2020 (Appendix Table 1).
- 3. Urban-rural differences in the prevalence risk of depressive symptoms over time
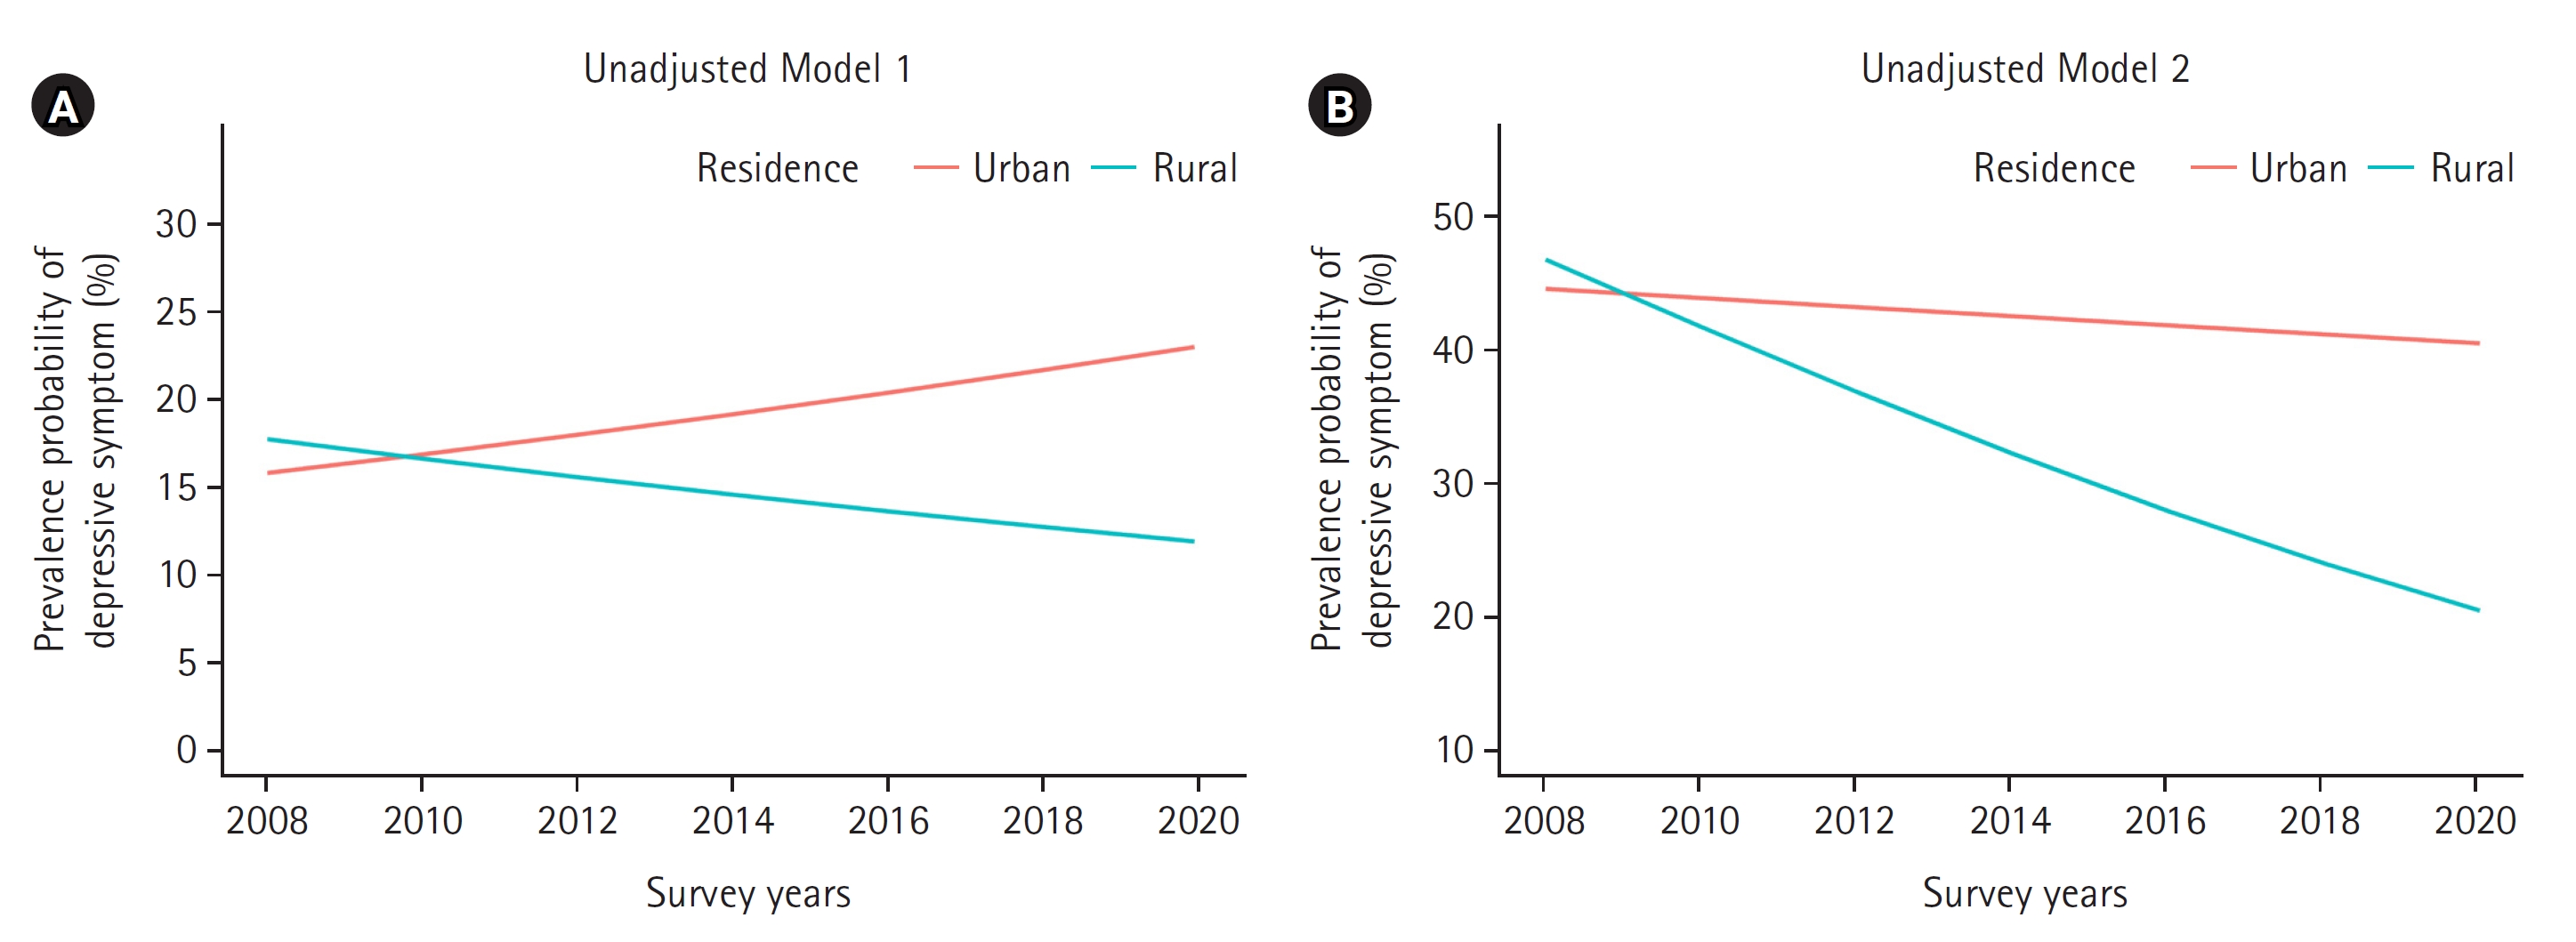
- Table 2 and Figure 3 show the effects of residential area on the prevalence of depressive symptoms over time in Model 1 (unadjusted) and Model 2 (adjusted) using a GEE analysis. Considering only the residential area, the risk of depressive symptoms was significantly lower in urban areas compared to rurality in Model 1 (OR=0.64, 95% CI:0.48–0.85) and Model 2 (OR=0.60, 95% CI:0.44–0.82). Models 1 and 2 showed a significant interaction effect on the risk of depressive symptoms between the survey period and residential area. As the duration of living in an area increased, the prevalence risk in older adults rose in urban areas compared to the rural ones in Model 1 (OR=1.17, 95% CI:1.11–1.23) and Model 2 (OR=1.19, 95% CI:1.12–1.26). Model 2 included additional control variables related to depressive symptoms. Despite this adjustment, the significant interaction effect between time and residential area on the risk of depressive symptoms persisted. Figure 3 displays the interaction effect between the survey period and residential area in Model 1 (unadjusted Model 1A) and Model 2 (adjusted Model 2B).
- 4. Factors related to the prevalence of depressive symptoms by urban and rural areas
- Table 3 presents the urban/rural differences in the associations between the prevalence of depressive symptoms and two factors: SA and social contact. In urban areas, having meetings with neighbors less than once a week (OR=1.33, 95% CI:1.15–1.54) was significantly associated with a higher risk of depressive symptoms. Contrastingly, in rural areas, occasional meetings with all children (OR=0.69, 95% CI:0.52–0.92) was significantly associated with a lower risk of depressive symptoms. Regarding the five components of SA, in urban areas, older individuals who had one or more chronic diseases were found to have a higher likelihood of experiencing depressive symptoms (OR=1.37, 95% CI:1.17–1.59) compared to those who had no such diseases. Contrastingly, no association was found between the presence of chronic diseases and risk of depressive symptoms in rural areas. In all areas, older people who had a limitation of daily activity (urban OR=1.94, 95% CI:1.66–2.26; rural OR=2.48, 95% CI:1.94–3.18), a cognitive dysfunction (urban OR=1.66, 95% CI:1.42–1.94; rural OR=1.80, 95% CI:1.36–2.38), and low life satisfaction (urban OR=2.80, 95% CI:2.37–3.31; rural OR=1.91, 95% CI:1.43–2.54) were found to be significantly associated with a higher risk of depressive symptoms compared to those who achieved each component of SA. There were no significant urban/rural differences in the association between the prevalence of depressive symptoms and active social engagement.
Results
- This study investigated urban and rural differences in depressive symptoms over time and identified factors associated with the prevalence of depressive symptoms among older adults using data from the KLoSA (2006–2020). Our primary finding was that residential areas affect this prevalence over time after adjusting for control variables, and that there were differences between urban and rural areas. Since the baseline with no depressive symptoms at the first follow-up survey in 2008, the prevalence of depressive symptoms in rural older adults was higher than in the urban ones. However, as the duration of residence increased, the trend reversed, and older adults in urban areas showed an increased risk of depressive symptoms compared with those in rural areas.
- While previous cross-sectional studies among Koreans or other Asian populations have reported no urban/rural differences in depressive symptoms [13,14] or were higher in rural areas [11,12,16], our longitudinal study revealed significant such differences, with higher rates in urban areas. Our finding is aligned with previous research results indicating that depressive symptoms are higher in urban than in rural residences in developed countries [6]. This suggests that longitudinal data may provide a better understanding of the impact of residency on depressive symptoms over time. Longitudinal studies may be valuable for gaining further insights into the mechanisms through which various neighborhood characteristics influence the differences in depressive symptoms between urban and rural residents, especially among older adults.
- Furthermore, our findings suggest that the place of residence or neighborhood can influence depressive symptoms in older adults [9,10,34]. Previous studies have reported that prolonged exposure to urban environments may have a negative impact on depression in older populations, whereas rural environments may have protective factors or provide a supportive social context that mitigates mental health risks in older adults [6,35]. A Chinese longitudinal study that investigated differences in neighborhood stressors associated with depressive symptoms among older adults in rural and urban settings found that, for the former, neighborhood stressors were primarily linked to the physical environment, while among the latter, these were associated with the social environment [36]. As such, depressive symptoms in older adults may be particularly influenced by the social environment in their living area [10,37]. However, there are currently no measurements of residential environmental variables in Korea's aging panel data, preventing the analysis of residential characteristics that may affect depressive symptoms. In Korea, studies on neighborhood effects have been relatively scarce compared to those on various individual level causes of depression [7,16,34]. Therefore, future research in this area is warranted.
- In this study, the prevalence of depressive symptoms is associated with SA and social contact in both urban and rural areas. SA has become essential for describing the quality of aging and promoting health in older adults [38]. Here, a low risk of depressive symptoms in older adults was associated with all five SA components, which supports previous findings [22,23]. Some subdomains of SA and the risk of depressive symptoms differed slightly between urban and rural older adults. Those with one or more chronic diseases living in urban areas had a higher risk than their rural counterparts. Meanwhile, in urban areas, the likelihood (OR=2.80) of low life satisfaction was higher than in rural areas, where the OR for the presence of disability was 2.48, which was relatively higher than in urban areas. These findings imply that, unlike in urban-dwelling older adults, the presence or absence of a daily living disability has a greater effect on the prevalence of depressive symptoms in rural older adults than the number of chronic diseases. Depressive symptoms are common among older people with chronic diseases, cognitive impairment, or disabilities [1,39]. The mental health of older adults can be improved through nursing interventions that enhance the key components of SA tailored to the characteristics of urban and rural residential areas.
- Less social contact with neighbors was associated with a higher risk of depressive symptoms in urban areas, whereas in the rural ones, occasional social contact with all children was associated with a lower risk of developing depressive symptoms. This finding is consistent with the results of previous studies showing differences in crucial social support resources between urban and rural areas [15,24,25]. In a systematic review of research on older adults living in Asian communities, those with a good overall degree of social support—including living with their families, having a wide social network, and having more contact with family and friends—were=more likely to have fewer depressive symptoms [24]. Family support has a greater influence on depression among community-dwelling older adults in Asian than in Western populations. This indicates that family institutions should be incorporated into programs and interventions designed to address depression in the Asian context [24]. Encouraging rural older adults to form social support networks with their children and urban older adults with their neighbors may help prevent depressive symptoms among those living in the community.
- One limitation of this study is that it did not explore the potential mechanisms accounting for changes and differences in rural/urban depressive symptoms due to the use of KLoSA data. Cross-sectional studies have found significant associations between the physical and social environments of a community and depression or depressive symptoms. In future research, incorporating environmental data into the study design can help investigate the longitudinal social and physical environments that contribute to rural/urban mental health disparities. Another limitation is related to the follow-up period, which extended from 2008 to 2020 after the 2006 baseline. Unfortunately, we were unable to analyze the urban and rural older adults who were excluded from the survey due to death during this time frame. This exclusion could have potentially introduced selection bias.
Discussion
- This study utilized a longitudinal sample of Korean older adults to identify changes in the prevalence of depressive symptoms between urban and rural residential areas over time. Unlike previous cross-sectional studies, our findings reveal that the urban prevalence increased over time compared to the rural one, highlighting the influence of residential areas. Furthermore, our study confirmed that this prevalence is associated with components of SA and social contact with neighbors or children, with some variations observed based on pertaining to urban or rural residential areas.
- These findings not only offer valuable insights into the relationship between residential areas and depressive symptoms but also highlight the necessity of nursing approaches that consider the characteristics of the living environments for reducing health disparities between regions. It highlights the need to accordingly tailor nursing interventions to ensure SA as well as social support from children and neighbors to prevent depression.
Conclusions
-
Conflict of interest
The authors declared no conflict of interest.
-
Funding
None.
-
Authors’ contributions
Bongjeong Kim contributed to conceptualization, methodology, and writing - original draft, review & editing. Jinseub Hwang, Dohyang Kim contributed to data curation, formal anlaysis, and visualization. Soo Jin Kang contributed to methodology, and writing - original draft, review & editing.
-
Data availability
Publicly available datasets were analyzed in this study. These data are here: (https://survey.keis.or.kr/eng/klosa/klosa01.jsp).
NOTES
Acknowledgments


- 1. Kok RM, Reynolds Ⅲ CF. Management of depression in older adults: A review. Journal of American Medical Association. 2017;317(20):2114–2122. https://doi.org/10.1001/jama.2017.5706ArticlePubMed
- 2. Shin J, Cho E. Trajectories of depressive symptoms among community-dwelling Korean older adults: Findings from the Korean longitudinal study of aging (2006–2016). BMC Psychiatry. 2022;22(1):246. https://doi.org/10.1186/s12888-022-03905-3ArticlePubMedPMC
- 3. World Health Organization. Depression [Internet]. Geneva: World Health Organization. 2022 [Cited 2023 Nov 9]. Available from: https://www.who.int/health-topics/depression#tab=tab_2
- 4. Lee YK, Kim SJ, Hwang NH, Yim JM, Chu BH, Nam EH, et al. The survey on the actual conditions of older persons in Korea. Policy Report. Sejong: Ministry of Health and Welfare; 2020 November. Report No.: 11-1352000-000672-12.
- 5. Murphy RA, Hagaman AK, Reinders I, Steeves JA, Newman AB, Rubin SM, et al. Depressive trajectories and risk of disability and mortality in older adults: Longitudinal findings from the health, aging, and body composition study. Journals of Gerontology: Series A, Biological Sciences and Medical Sciences. 2016;71(2):228–235. https://doi.org/10.1093/gerona/glv139ArticlePubMedPMC
- 6. Purtle J, Nelson KL, Yang Y, Langellier B, Stankov I, Diez Roux AV. Urban-rural differences in older adult depression: A systematic review and meta-analysis of comparative studies. American Journal of Preventative Medicine. 2019;56(4):603–613. doi: 10.1016/j.amepre.2018.11.008. Epub 2019 Feb 16. PMID: 30777704.ArticlePubMed
- 7. Kim BJ. Individual and community-level factors affecting depressive symptoms among Korean older adults. Journal of Wellness. 2020;15(4):695–706. https://doi.org/10.21097/ksw.2020.11.15.4.695Article
- 8. Leggett A, Zarit SH. Prevention of mental disorder in older adults: Recent innovations and future directions. Generations. 2014;8(3):45–52. PubMedPMC
- 9. Diez Roux AV, Mair C. Neighborhoods and health. Annals of the New York Academy of Sciences. 2010;1186:125–145. https://doi.org/10.1111/j.1749-6632.2009.05333.xArticlePubMed
- 10. Kim D. Blues from the neighborhood? Neighborhood characteristics and depression. Epidemiologic Reviews. 2008;30:101–117. https://doi.org/10.1093/epirev/mxn009ArticlePubMed
- 11. Li LW, Liu J, Xu H, Zhang Z. Understanding rural-urban differences in depressive symptoms among older adults in China. Journal of Aging and Health. 2016;28(2):341–362. https://doi.org/10.1177/0898264315591003ArticlePubMed
- 12. Sasaki Y, Shobugawa Y, Nozaki I, Takagi D, Nagamine Y, Funato M, et al. Rural-urban differences in the factors affecting depressive symptoms among older adults of two regions in Myanmar. International Journal of Environmental Research and Public Health. 2021;18(6):2818. https://doi.org/10.3390/ijerph18062818ArticlePubMedPMC
- 13. Kim JM, Stewart R, Shin IS, Yoon JS, Lee HY. Lifetime urban/rural residence, social support and late-life depression in Korea. International Journal of Geriatric Psychiatry. 2004;19(9):843–851. https://doi.org/10.1002/gps.1175ArticlePubMed
- 14. Kang HW, Park KM. Comparison of correlation of depression in late-life between urban and rural areas. Journal of Korean Gerontological Society. 2012;32(1):129–143.
- 15. Kim C, Chang EJ, Kim CY. Regional differences in the effects of social relations on depression among Korean elderly and the moderating effect of living alone. Journal of Preventative Medicine and Public Health. 2021;54(6):441–450. https://doi.org/10.3961/jpmph.21.337ArticlePubMedPMC
- 16. Kim S, Cho S, Morgan MR. Neighborhood and depressive symptoms in older adults living in rural and urban regions in South Korea. Healthcare (Basel, Switzerland). 2023;11(4):476. https://doi.org/10.3390/healthcare11040476ArticlePubMedPMC
- 17. Kim KM, Kim JH, Rhee HS. A study on depression levels and influencing factors in the elderly: A comparison between low-income and ordinary-income households. Health and Social Welfare Review. 2020;40(3):286–314. https://doi.org/10.15709/hswr.2020.40.3.286Article
- 18. Kim JH, Park EC, Lee SG, Lee Y, Jang SI. Effects of social integration on depressive symptoms in Korea: Analysis from the Korean Longitudinal Study of Aging (2006-12). Australian Health Review : A Publication of the Australian Hospital Association. 2017;41(2):222–230. https://doi.org/10.1071/AH16029ArticlePubMed
- 19. Fernández-Ballesteros R. The concept of successful aging and related terms. In: Fernández-Ballesteros R, Benetos A, Robine J-M, editors. The Cambridge Handbook of Successful Aging. Cambridge: Cambridge University Press; 2019. p. 6–22.
- 20. Choi HJ, Han CK. Impact of successful aging in old age on trajectories of depression. Journal of the Korean Gerontological Society. 2021;41(6):1037–1054. https://doi.org/10.31888/JKGS.2021.41.6.1037Article
- 21. Jeste DV, Savla GN, Thompson WK, Vahia IV, Glorioso DK, Martin AS, et al. Association between older age and more successful aging: Critical role of resilience and depression. The American Journal of Psychiatry. 2013;170(2):188–196. https://doi.org/10.1176/appi.ajp.2012.12030386ArticlePubMedPMC
- 22. Kim M. Cross-age networks, successful aging, and depression among middle-aged South Koreans living in Seoul. Journal of Intergenerational Relationships. 2021;19(1):35–55. https://doi.org/10.1080/15350770.2021.1868220Article
- 23. Nari F, Jang BN, Kim S, Jeong W, Jang SI, Park EC. Association between successful aging transitions and depressive symptoms among older Korean adults: Findings from the Korean Longitudinal Study of Aging (2006-2018). BMC Geriatrics. 2021;21(1):352. https://doi.org/10.1186/s12877-021-02250-6ArticlePubMedPMC
- 24. Tengku Mohd TAM, Yunus RM, Hairi F, Hairi NN, Choo WY. Social support and depression among community dwelling older adults in Asia: A systematic review. BMJ Open. 2019;9(7):e026667. https://doi.org/10.1136/bmjopen-2018-026667ArticlePubMedPMC
- 25. Green MJ, Whitley E, Niedzwiedz CL, Shaw RJ, Katikireddi SV. Social contact and inequalities in depressive symptoms and loneliness among older adults: A mediation analysis of the English Longitudinal Study of Ageing. SSM - Population Health. 2021;13:100726. https://doi.org/10.1016/j.ssmph.2021.100726ArticlePubMedPMC
- 26. Boo KC, Chang JY. Korean longitudinal study of ageing: Research design for international comparative studies. Survey Research. 2006;7(2):97–122.
- 27. Anderson EM, Malmgren JA, Carter WB, Patrick DL. Screening for depression in well older adults: Evaluation of short form of the CES-D (Center for Epidemiologic Studies Depression Scale). American Journal of Preventative Medicine. 1994;10(2):77–84. https://doi.org/10.1016/S0749-3797(18)30622-6Article
- 28. Kohout FJ, Berkman LF, Evans DA, Cornoni-Huntley J. Two shorter forms of the CES-D (Center for Epidemiological Studies Depression) depression symptoms index. Journal of Aging and Health. 1993;5(2):179–193. https://doi.org/10.1177/089826439300500202ArticlePubMed
- 29. Irwin M, Artin KH, Oxman MN. Screening for depression in the older adult: Criterion validity of the 10-item Center for Epidemiological Studies Depression Scale (CES-D). Archives of Internal Medicine. 1999;159(15):1701–1704. https://doi.org/10.1001/archinte.159.15.1701ArticlePubMed
- 30. Lu W, Pikhart H, Sacker A. Domains and measurements of healthy aging in epidemiological studies: A review. The Gerontologist. 2019;59(4):e294–e310. https://doi.org/10.1093/geront/gny029ArticlePubMedPMC
- 31. Teater B, Chonody JM. What attributes of successful aging are important to older adults? The development of a multidimensional definition of successful aging. Social Work in Health Care. 2020;59(3):161–179. https://doi.org/10.1080/00981389.2020.1731049ArticlePubMed
- 32. Kim HJ, Min JY, Min KB. Successful aging and mortality risk: The Korean longitudinal study of aging (2006-2014). Journal of the American Medical Directors Association. 2019;20(8):1013–1020. https://doi.org/10.1016/j.jamda.2018.12.010ArticlePubMed
- 33. Feng Q, Son J, Zeng Y. Prevalence and correlates of successful ageing: A comparative study between China and South Korea. European Journal of Ageing. 2015;12(2):83–94. ArticlePubMedPMCPDF
- 34. Hwang JH, Kim YJ. Neighborhood effect on elderly depression in Republic of Korea. International Journal of Environmental Research and Public Health. 2023;20(6):5200. https://doi.org/10.3390/ijerph20065200ArticlePubMedPMC
- 35. Bonnell LN, Clifton J, Rose GL, Waddell EN, Littenberg B. Urban-rural differences in mental and physical health among primary care patients with multiple chronic conditions: A secondary analysis from a randomized clinical trial. International Journal of Environmental Research and Public Health. 2022;19(23):15580. https://doi.org/10.3390/ijerph192315580ArticlePubMedPMC
- 36. Wang Y, Chen YC, Shen HW, Morrow-Howell N. Neighborhood and depressive symptoms: A comparison of rural and urban Chinese older adults. The Gerontologist. 2018;58(1):68–78. https://doi.org/10.1093/geront/gnx063ArticlePubMed
- 37. Barnett A, Zhang CJP, Johnston JM, Cerin E. Relationships between the neighborhood environment and depression in older adults: A systematic review and meta-analysis. International Psychogeriatrics. 2018;30(8):1153–1176. https://doi.org/10.1017/S104161021700271XArticlePubMed
- 38. Kim BJ. Individual and environmental factors associated with successful aging among Korean older adults: Multilevel analysis of cross-sectional nationwide survey data. Archives of Gerontology and Geriatrics. 2023;113:105062. https://doi.org/10.1016/j.archger.2023.105062ArticlePubMed
- 39. Pocklington C. Depression in older adults. British Journal of Medical Practitioners. 2017;10(1):a1007.
 PubReader
 ePub Link
 Cite
Cite